Working with basic topography data
, 4 min, 715 words
Tags: gis mount-erie-fire
You could perhaps tell from some previous posts that I'm a bit of a geospatial data nerd. In keeping with that, for several years I've been searching on and off for reliable sources of elevation/topographic data. This week, at long last, I think my search can be over.
The short version: You can download elevation data from NASA's Shuttle Radar Topography Mission and then generate contour lines from that.

Who needs topographic data anyway?
If you've ever navigated with a map and compass, you've likely seen topographic maps, which show contour lines of constant height. They're a great way to get a sense for the terrain in an area at a glance – lots of lines close together means steep terrain, for instance. And it turns out in firefighting, you care about terrain quite a bit. In wildland, we talk about the fire behavior triangle of fuels, weather, and topography. In structural firefighting, you still care about pumping water up/down hills, because it will affect your pressures. In patient care, it's useful to know if you need to hike up a mountain to reach your patient, or if they'll be a relatively flat walk from the road.
In other words, I want topographic data, and I think you might too.
Download that SRTM data
- Go to NASA's Earth Data interface
- You'll need to create an account, which for me just meant generating a password, answering a few questions about my areas of interest, and accepting their terms of use. I...confess I did not read in depth, but my understanding is that the data is for non-commercial use and should be attributed appropriately.
- You're looking for the Shuttle Radar Topography Mission (SRTM), which I was able to select under "Organizations", and you probably want the global, one-arc-second dataset. Ideally choose v3, which does some fancy patching for areas that the actual shuttle mission might have missed or had larger error bars in.
- Search for the latitude/longitude of the southwest corner of your area
of interest. For example, if I'm at 48.5 degrees north and 122.3 degrees
west, I'll have to search for
N48W123*in the granule search bar at the left. If in doubt, search for your best guess, import it in a GIS viewer like QGIS, and check where it falls relative to your actual area. - Download granule(s) of interest. These will be
.hgtfiles. - Import those .hgt files as rasters in QGIS.
- Get contours from the elevation raster data via Raster -> Extraction -> Contour. I left it with the default spacing of 10 meters, but if you want to convert to feet you might use 3.05 or 30.5 meter spacing (for 10 or 100 feet, respectively).
- Once you've done that, you'll probably want to visualize them in a more conventional way. I found this tutorial useful in setting up the contour view settings.
In short
- Topographic data is useful in lots of cases, including for folks thinking about fire suppression and patient care.
- You can download fairly high-resolution data from NASA's SRTM.
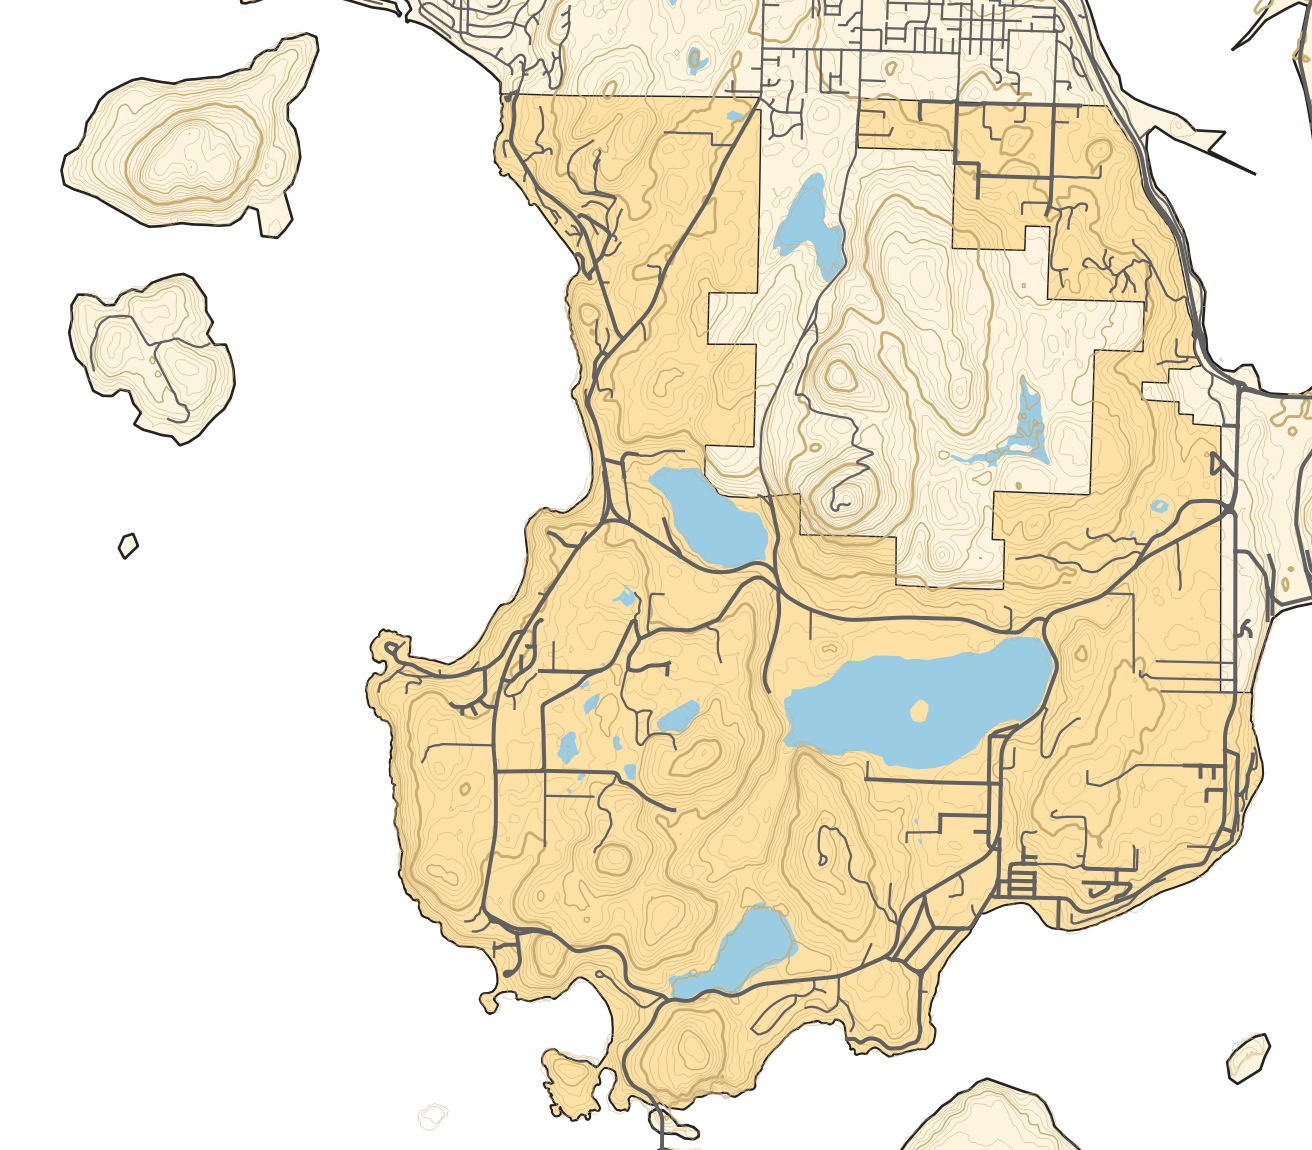
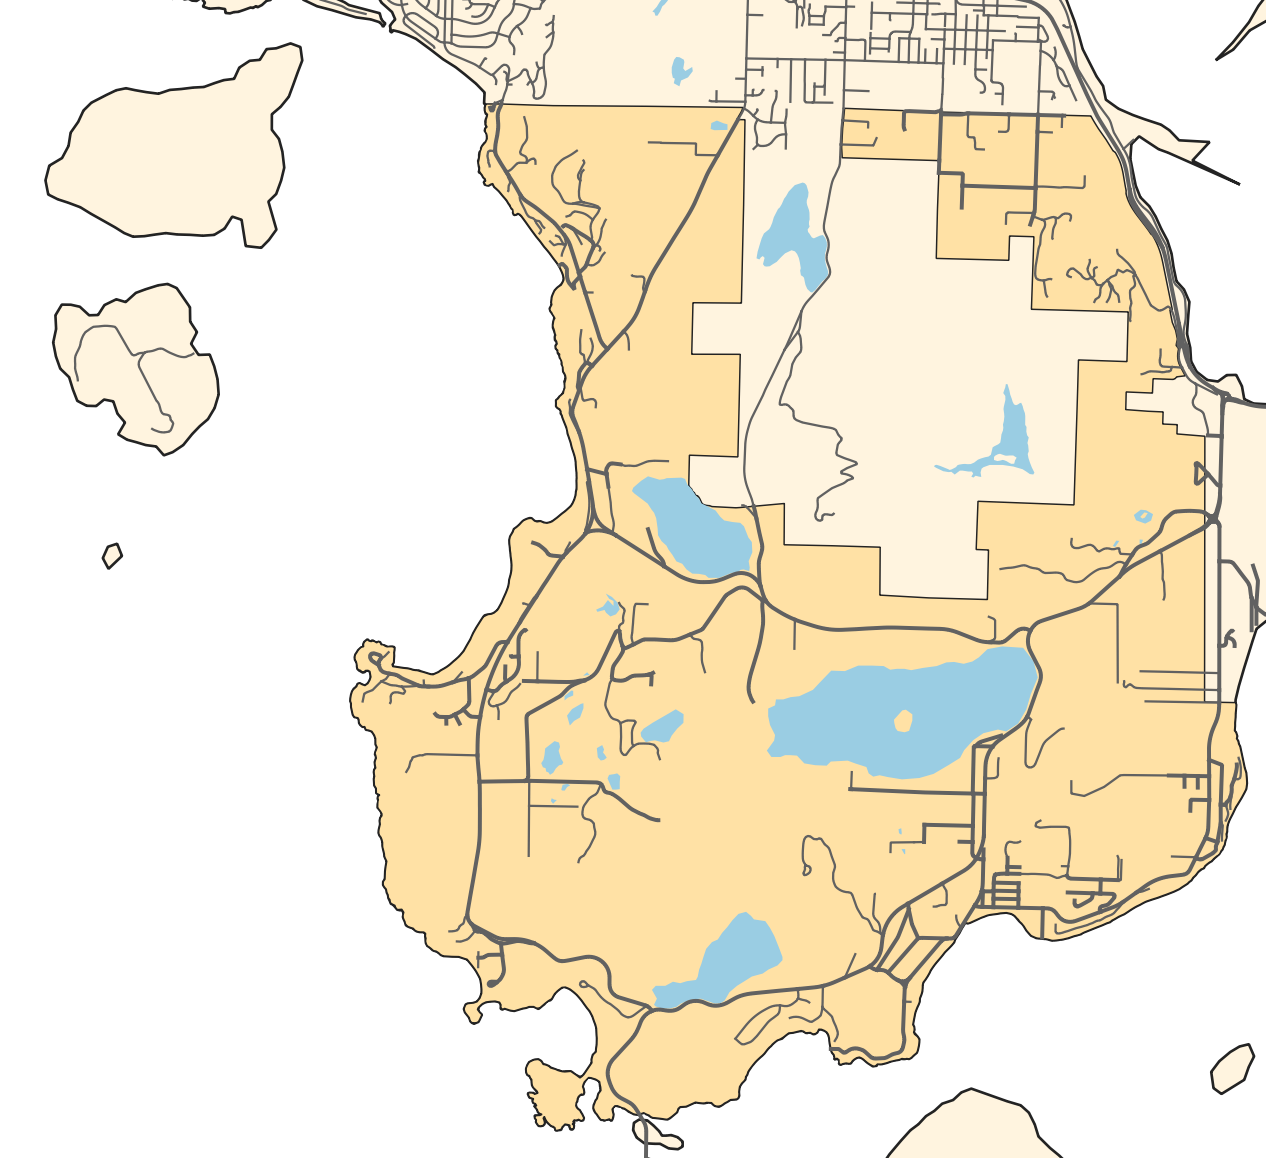
- It looks super snazzy when you put it on a map. (see before and after below)


I like to think that it's just as easy to read the map on the right, and it provides objectively more data if you're prepared to read the contour lines. Hopefully this method can be of use to others as well!