Chaotic Pendulum
, 16 min, 3157 words
Tags: physics presenting-my-work
This post was originally a paper written with Vivian Steyert for a class, Theoretical Mechanics. In summer 2015 I adapted it for this blog. If you're interested in the original paper (pdf), you can read it here.
In writing this paper, Vivian and I investigated the behavior of a chaotic pendulum present in a lab at Harvey Mudd through modeling and simulation in Mathematica. In the modeled system in the undamped, undriven case, we observed small oscillations. With increasing drive frequency, the behavior becomes chaotic, and a region of period doubling is present at frequencies just above the chaotic regime. Both the onset of chaos and the general shape of Poincaré plots are similar to those observed in the physical system.
Introduction
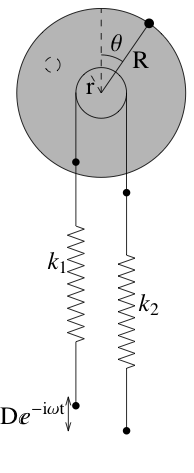
The pendulum system consists of an aluminum disk with uniformly-distributed mass $M$ and radius $R$, to which is attached an eccentric mass of mass $m$, at the edge of the disk. The setup is shown above. There is a permanent magnet held close to the disk, which generates eddy currents and thus produces a (hopefully) linear damping force. The disk is attached to a pulley of radius $r$, which has a string wrapped around it in such a way as to avoid slipping. This string is attached to a spring on each side. The spring on the left side has a spring constant $k_1$, and the one on the right has a spring constant $k_2$. The far end of spring 2 is fixed. Finally, the whole system is driven by means of a rotary motor fixed to the end of spring 1, which drives the spring according to $De^{-i\omega t}$.
Equation of Motion
We will use a single generalized coordinate $\theta$, which will describe the angle between the vertical and the eccentric mass. We define $\theta$ to be zero when the eccentric mass is at the top of the disk, and to be positive in the clockwise direction, as shown.
Observe that the moment of inertia $I$ of the combined disk-mass system is $$I = \frac{1}{2}MR^2+mR^2.$$ Thus the kinetic energy of the system is $$T = \frac{1}{2}I\dot\theta^2 = \frac{1}{2}\left(\frac{1}{2}MR^2+mR^2\right)\dot\theta^2.$$ The potential energy of the system is the sum of the gravitational and spring potential energies. Define the stretch of the springs when the eccentric mass is in unstable equilibrium at the top of the disk to be $x_1$ and $x_2$, respectively. Then the potential energy of the system is
$$\begin{aligned} U &= mgR\cos\theta + \frac{1}{2}k_1\left(x_1+r\theta-De^{-i\omega t}\right)^2 +\frac{1}{2}k_2\left(x_2-r\theta\right)^2.\end{aligned}$$
In general, we have used $De^{-i\omega t}$ to describe the drive, but in our model, we used the imaginary part of this complex exponential. This was in order to have the drive be in neutral position at the starting time, which matches the data collection on the physical apparatus. We took the drive to be entirely in a line, rather than in a circle as in the physical system. We also treated the springs as ideal.
At any equilibrium position, $U'(\theta)$ is zero. Examination of $U'(\theta)$ at the unstable equilibrium at the top of the disk yields
$$\begin{aligned} U'(\theta) &= mgR\sin\theta - k_1 r\left(x_1+r\theta-De^{-i\omega t}\right) +k_2 r\left(x_2-r\theta\right)\\ U'(0) &= -k_1x_1 + k_2x_2 = 0\\ k_1x_1 &= k_2x_2.\end{aligned}$$
Here the drive has been omitted, as we take it to be at the center of its displacement when the apparatus is balanced.
Note that the potential and kinetic energies do not account for damping. This will be addressed shortly. The Lagrangian (sans damping) is $$L = \frac{1}{2}I\dot\theta^2 - mgR\cos\theta - \frac{1}{2}k_1\left(x_1+r\theta-De^{-i\omega t}\right)^2\\ -\frac{1}{2}k_2\left(x_2-r\theta\right)^2.$$ Euler’s equation shows
$$\begin{align} \mathbf{F}\cdot\frac{\partial\mathbf{r}}{\partial \theta}&= \frac{d}{dt}\frac{\partial L}{\partial\dot\theta} - \frac{\partial L}{\partial \theta} \\ -c\dot\theta &= I\ddot\theta-\left(mgR\sin\theta- k_1r\left(x_1+r\theta-De^{-i\omega t}\right) +k_2r(x_2-r\theta)\right).\end{align}$$
The left-hand term is $-c \dot\theta$ because the external force from the damper will eventually end up being proportional to the speed of rotation. This $c$ does not correspond to the damping coefficient for the eddy-current damper. The whole term is negative because the damping always opposes the motion of the system. We assume that the damping from the magnet overwhelms the effect of friction, which we have ignored.
The relationship between the spring constants and $x_i$’s simplifies the equation of motion to
$$\begin{aligned} -c\dot\theta &= I\ddot\theta-mgR\sin\theta + (k_1+k_2)r^2\theta - k_1rDe^{-i\omega t}.\end{aligned}$$
This is the equation of motion for the system.
At this point, we would normally transform this equation of motion into a dimensionless equivalent for ease of analysis (and if you really want to see the math, you can find it in the original paper). However, we hope to compare the behavior we predict based on the equation of motion with the observed behavior of the system, and this comparison will be more explicit if we instead use real (dimension-ful) time.
System parameters
Our project is based on a physical system that is sitting in the lab space downstairs. As such, we fixed most of our constants to match the parameters of that system. We made this decision in order to compare theoretical predictions with experimental results. Our parameters are: $$\begin{array}{rcl} \text{Mass of disk} & M & {0.120~\mathrm{kg}}\\ \text{Eccentric mass} & m & {0.01454~\mathrm{kg}}\\ \text{Radius of disk} & R & {0.0475~\mathrm{m}}\\ \text{Radius of pulley} & r & {0.024~\mathrm{m}}\\ \text{Left spring constant} & k_1 & {3.12~\mathrm{N/m}}\\ \text{Right spring constant} & k_2 & {3.13~\mathrm{N/m}}\\ \text{Acceleration due to gravity} & g & {9.81~\mathrm{m/s^2}}\\ \text{Damping constant} & c & {0.0001~\mathrm{kg,m/s}}\\ \text{Drive amplitude} & D & {0.0254~\mathrm{m}}\\ \end{array}$$ where the damping constant was chosen somewhat arbitrarily. We chose the value of $c$ based on approximate behavior of the system; that is with chaotic behavior beginning and ending between 0 and 1 Hz. The drive amplitude of the physical system can be varied. Unless otherwise noted, we have used $D=0.0254~\mathrm{m}$ in this report. The parameter we will vary in most of this investigation is the drive frequency, $\omega$.
Results
Equilibrum and Small Oscillations
The system, as one might gather from physical intuition, has an unstable equilibrium position with the eccentric mass vertical, and two stable equilibrium positions, one on each side. Graphing the potential energy as a function of $\theta$, with no drive amplitude, agrees with expectations, as shown below. The potential energy increases as we wind the pendulum up further, with small dips as the height, and potential energy due to gravity, fluctuate.
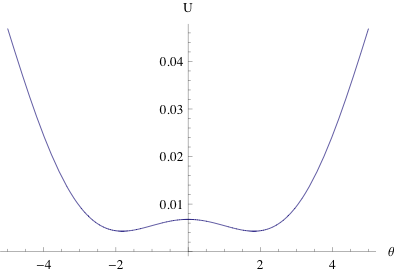
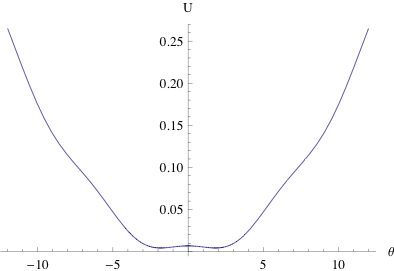
The equilibrium angles can be calculated based on our physical quantities; they are the values of $\theta$ that solve $(k_1+k_2) r^2 \theta = m g R \sin(\theta),$ which in our setup are \(\pm1.82265~\mathrm{radians}\) (and zero). The equilibrium point at $\theta=0$ is unstable, while the other two are local minima in potential energy and are thus stable. We expect that oscillation will be around one of these stable equilibrium positions or switching between them.
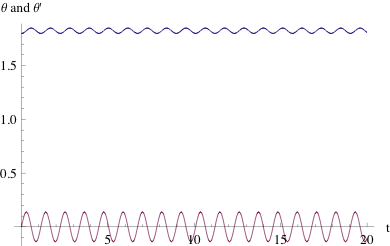
For small oscillations, we expect the mass to stay in one of the potential wells, exhibiting simple periodic motion. By setting the damping term and drive amplitude to zero, we can investigate a simplified version of this system. As shown in the plot below, a small displacement from the stable equilibrium in either potential well results in motion that looks a lot like simple harmonic oscillation.
General Behavior
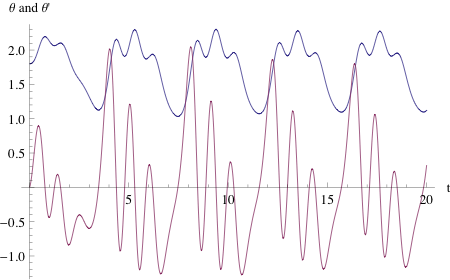
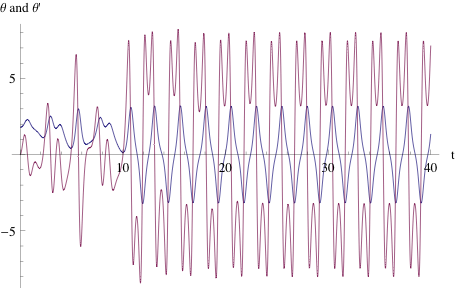
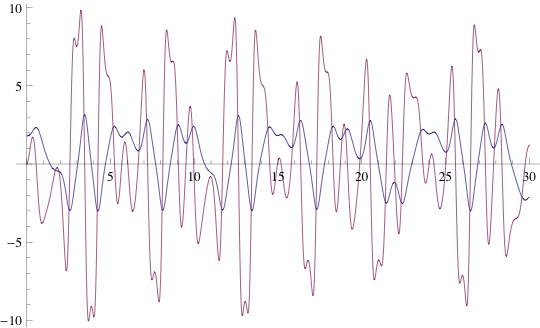
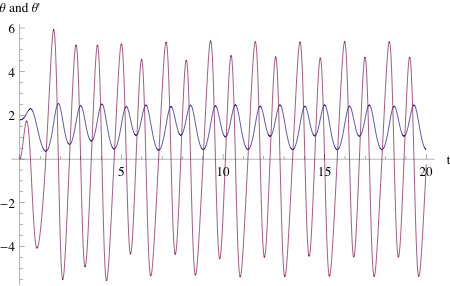
Adding damping and drive, of course, makes the system more interesting. The plots below show some time traces of the motion for different drive frequencies. At low frequencies, the eccentric mass stays in one well with complicated but periodic behavior. As we increase frequency, we encounter some regions where the mass periodically switches between positive and negative $\theta$, regions where it stays in one potential well, and eventually, we encounter a region of chaotic motion. At the highest frequencies the physical system is built for (around 1 Hz), the system goes back to periodic motion in one well.
Phase plots
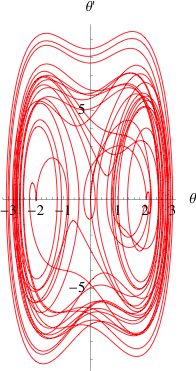
The chaotic pendulum system may be viewed as traveling through the three-dimensional phase space defined by the phase of the drive and the eccentric mass’s angular position and velocity. The system is completely deterministic, so if its location in phase space at a starting time is known, its behavior can be predicted for all time. This means that if the path traced out by the system in phase space crosses itself, it is bound to repeat periodically in a closed loop.
A useful way of visualizing the motion of the system is using a phase plot, which shows the bob’s angular velocity with respect to its angular position. After an initial transient is allowed to die out, any periodic behavior will be seen as a closed loop. An example of a phase plot of periodic behavior is shown below.
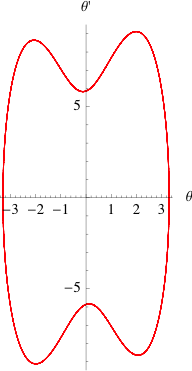
Nonperiodic behavior leads to a more dynamic phase plot. An example phase plot of nonperiodic behavior is shown below. Note that the path can cross itself without becoming periodic because this two-dimensional phase plot leaves out the phase of the drive, which is required in order to fully describe the system’s behavior.
Poincaré plots
Phase plots are useful for examining system behavior over short periods of time, but tend to get cluttered over longer runs. In such cases, a Poincaré plot can be used to examine the system’s behavior. Poincaré plots have the same axes as phase plots, but the position and velocity data are only taken once per drive cycle. Thus, if the behavior is periodic with frequency equal to the drive frequency, we expect our Poincaré plot to show a single dot — the system comes back to the same state after each drive period. For chaotic motion, we expect many dots, as the motion is not really periodic so the drive period will end with the system in a wide variety of states. Here are Poincaré plots for several drive frequencies:


Bifurcation diagrams
Bifurcation diagrams can be used in order to get a large-scale understanding of a system. They show a set of points from Poincaré plots at a range of frequencies and can give a good idea of boundaries of chaos, as well as regions of period doubling. The large-scale bifurcation diagram and a zoomed version of a region of period doubling are shown below.
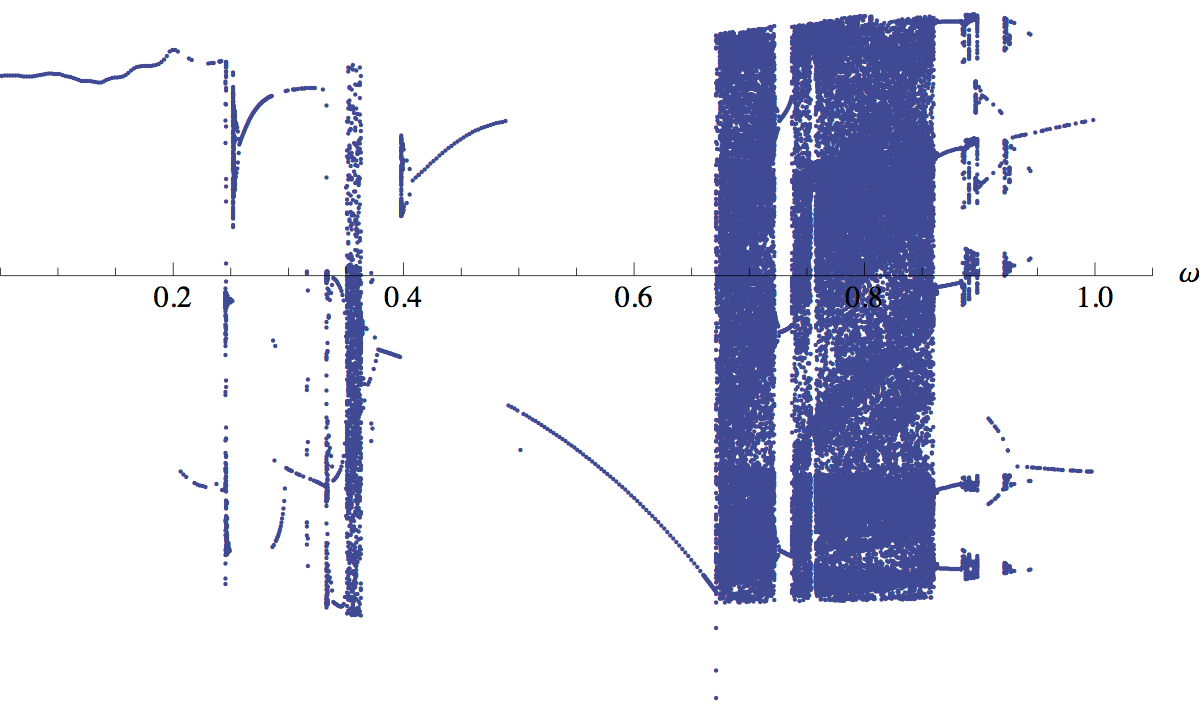
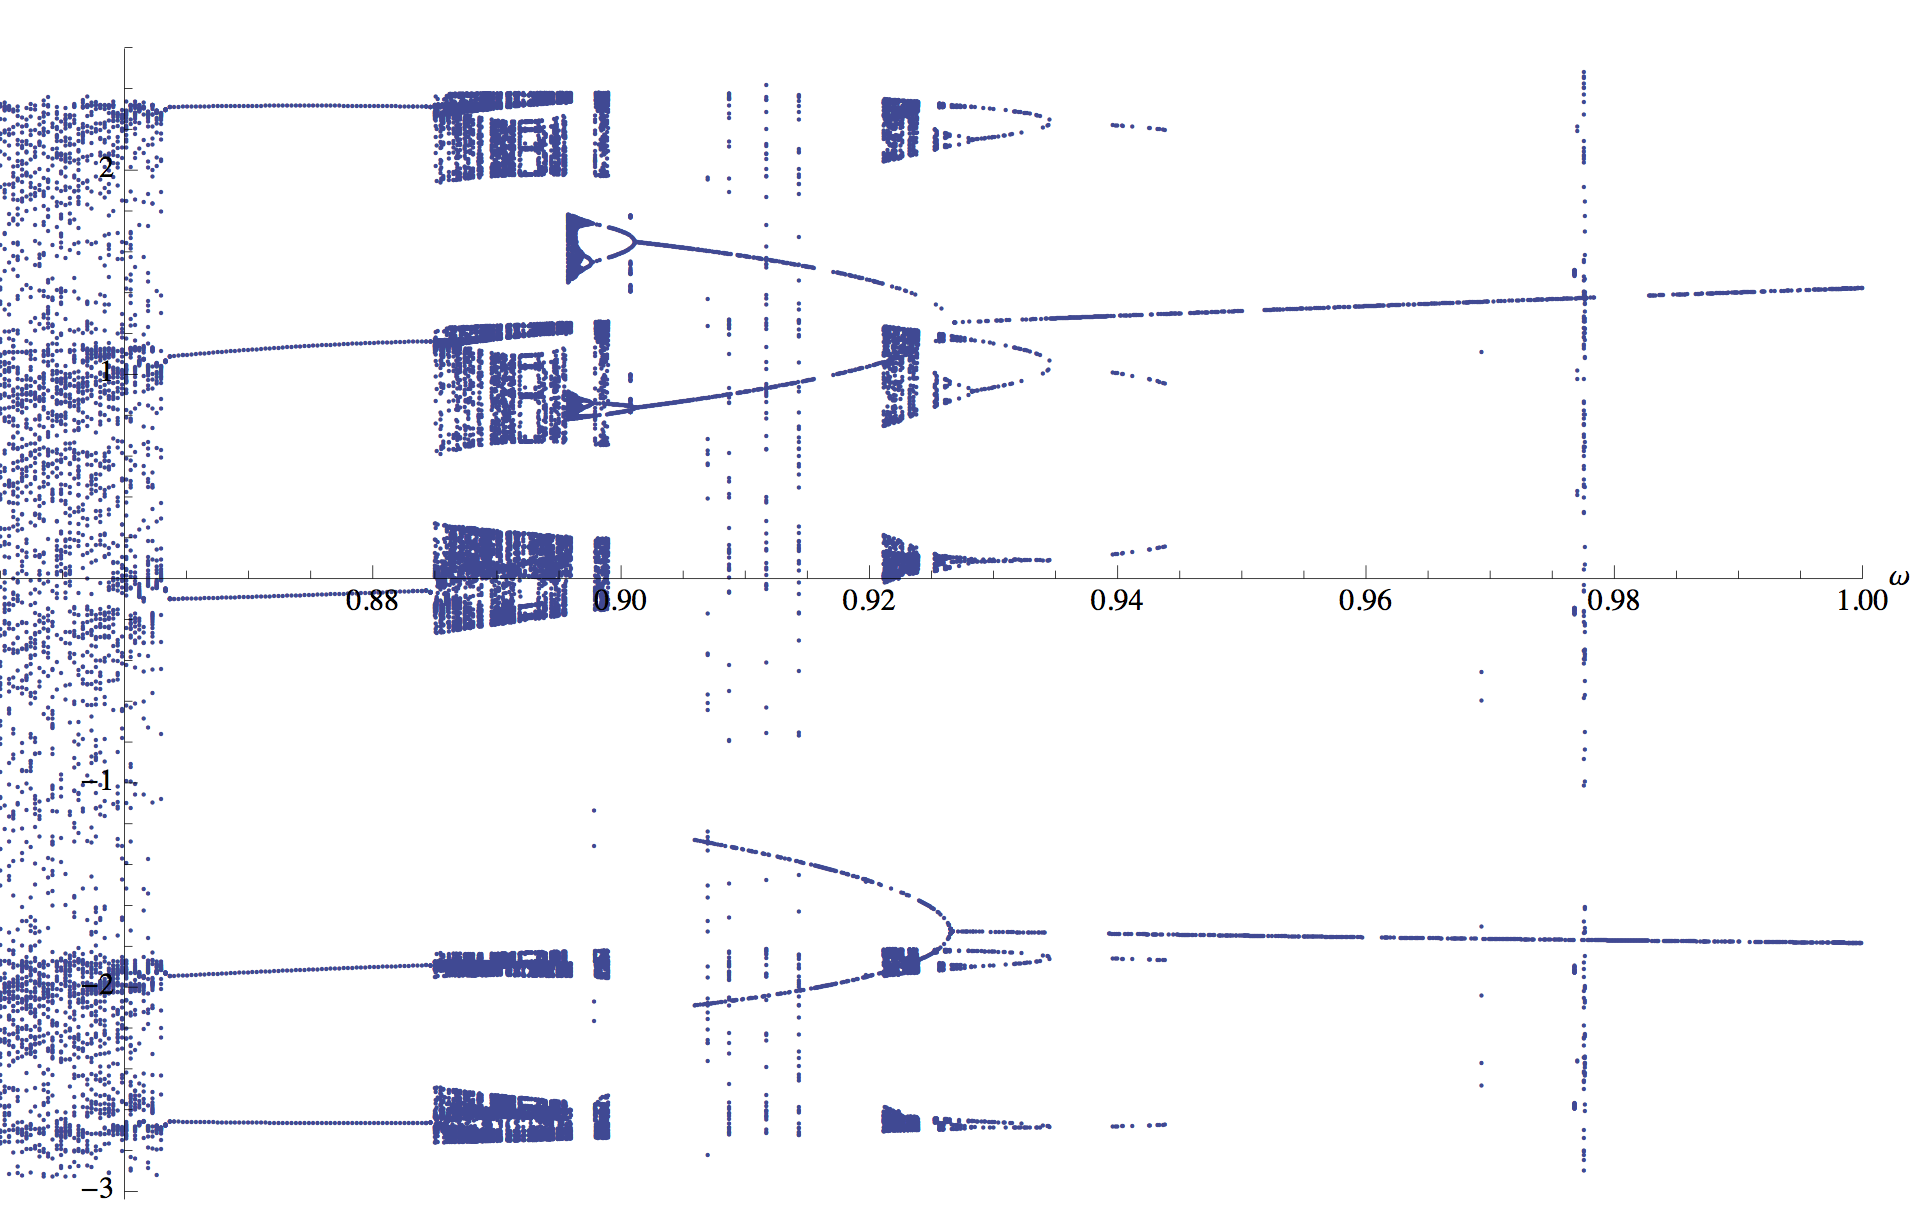
From the large-scale plot we see that the main chaotic region occurs at frequencies between about $0.65~\mathrm{Hz}$ to $0.86~\mathrm{Hz}$. At frequencies immediately below the lower end of this chaotic behavior the system behaves periodically with only one period, before which it exhibits some regional periodic and chaotic behavior. At frequencies just above the primary chaotic boundary, there is a region of bifurcation (shown in the detailed plot above).
Comparison to Experiment
Since we have access to the physical system modeled in this report, some limited comparisons could be made between what our model predicts and what we observed experimentally. As mentioned previously, most parameters should be the same in experiment and model, so we expect there to be substantial correlation between experimental and theoretical results.
Onset of Chaos
A benefit of the bifurcation plot is the ease with which the frequency at which chaos begins can be identified. From the bifurcation plot, the onset of chaos is the frequency at which the dense region begins, around $0.672~\mathrm{Hz}$.
While it is easy to identify the approximate onset of chaos by just ‘eyeballing’ the bifurcation plots, it is difficult to find a unique onset of chaos using a script, because the lower chaotic boundary is itself chaotic. For the purposes of the plots below, the ‘onset’ was taken to be the first non-isolated vertical band in the bifurcation plot, to within $0.001~\mathrm{Hz}$.
The onsets of chaos in our theoretical predictions compare closely with the experimental values for the onset of chaos. Rough plots comparing the frequencies at which chaos begins in the physical system and the predictions from our model are shown in the plots below The frequencies at which chaos begins are similar between theory and experiment, but the drive amplitudes at which these frequencies of onset occur are slightly offset.
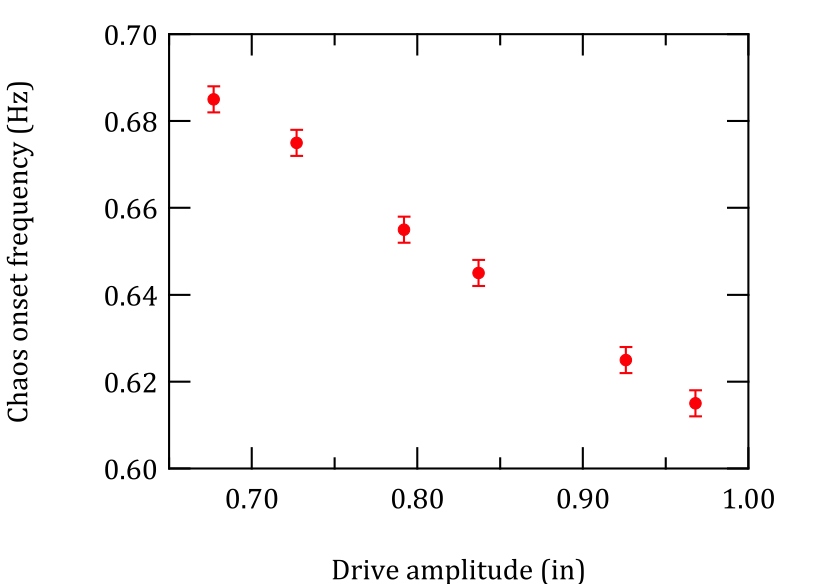
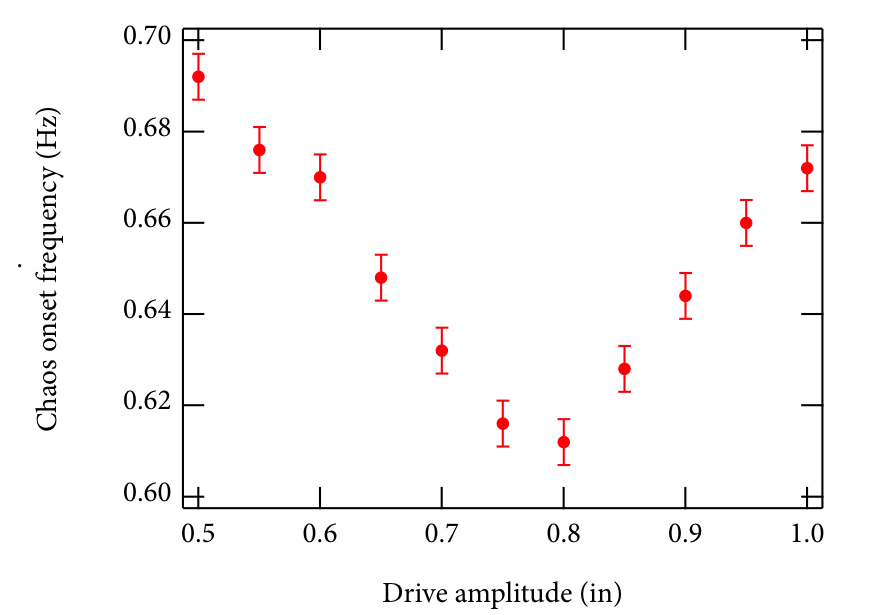
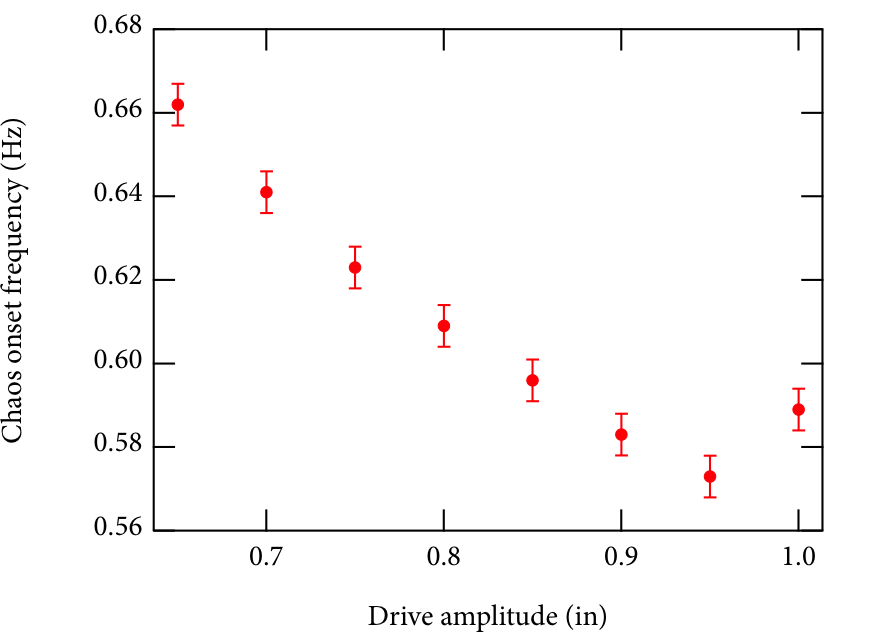
This difference can largely be accounted for by changing our damping constant. Choosing $c=0.00015~\mathrm{kg,m/s}$ yields the chaos onset plot shown below. This new plot is more in line with the trend determined experimentally, but the onset frequencies seem to be lower by around $0.02~\mathrm{Hz}$. As mentioned previously, the value of the damping coefficient is known to limited precision, and this altered value is just as reasonable an estimate as the one we have used thus far.
Qualitative Comparison of Poincaré Plots
The Poincaré plots produced by our model were also compared to the Poincaré plots from the experimental setup in the Sophomore Lab. The Poincaré plots are shown below, and they appear qualitatively similar. It is possible that adjusting the damping constant as discussed above would improve the resemblance.


Conclusion
The behavior of a sinusoidally-driven chaotic pendulum has been investigated for a variety of drive frequencies. The system exhibits chaotic behavior, as shown in the phase plots, Poincaré plots, and bifurcation diagrams. Branching behavior was observed for frequencies just over those in the chaotic region.
The range of frequencies at which chaotic behavior was predicted to begin aligned well with the observed onset of chaos, but the drive amplitudes that generated these onset frequencies were offset by around 0.2 inches. This offset can be reduced by altering the damping constant. Poincaré plots determined theoretically and experimentally appeared at least qualitatively similar, which is striking given the assumptions made from the outset.